How to Automate Google Sheets Reporting with Make.com (No Zapier, No Manual Copying)

If you’re still opening Google Sheets every Monday to manually paste in last week’s numbers, you’re burning time on something a machine can do in two seconds. This tutorial shows you exactly how to automate Google Sheets reporting with Make.com — pulling data from your real sources, writing it to the right cells, and running on a schedule without you touching it.
No Zapier. No code. Just a working scenario you can build in under an hour.
We’re building a weekly reporting dashboard that pulls data from two sources (a form tool and a CRM), aggregates it in Google Sheets, and timestamps each run. The same pattern applies if your sources are different — swap the modules, keep the structure.
What You’ll Build
A scheduled Make.com scenario that:
- Triggers every Monday morning at 8 AM
- Pulls last week’s data from Typeform (new submissions) and HubSpot (new contacts)
- Writes summary rows into a Google Sheets dashboard tab
- Stamps the run date so you always know when the data refreshed
If you haven’t connected Make.com to Google Sheets before, the lightweight database setup guide covers the initial connection and permissions — worth a quick read before continuing.
Before You Start: Sheet Structure Matters
Make.com writes to specific columns by header name or column letter. If your sheet has no headers, every mapping becomes a guessing game. Set this up first.
Create a tab called Weekly Report with these headers in row 1:
- A1:
Week Starting - B1:
Form Submissions - C1:
New Contacts (CRM) - D1:
Notes - E1:
Last Updated
Each scenario run will append one new row. After a month, you have four rows — a clean rolling log. That’s your living dashboard.
Step 1: Create a New Scenario in Make.com
Log into Make.com and click Create a new scenario. You’ll land on the canvas with the big plus icon in the center. Start here.
If you’re brand new to the canvas, the beginner scenario build guide walks through the interface basics. This tutorial assumes you know how to add modules and connect accounts.
Step 2: Set the Schedule Trigger
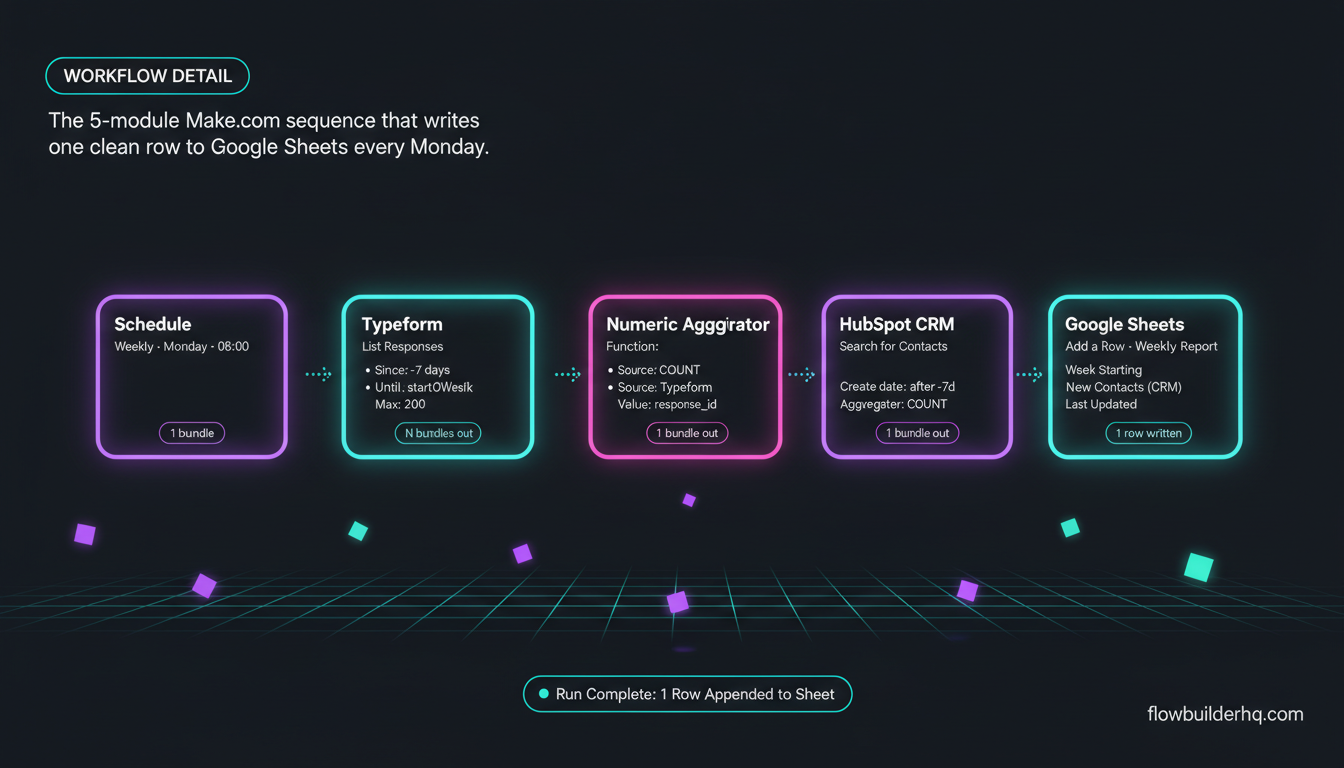
Click the central plus and search for Schedule. Select Schedule > Run a scenario.
In the Schedule settings:
- Set Run scenario to: Weekly
- Set Day of the week to: Monday
- Set Time to: 08:00
- Set your timezone correctly — Make.com defaults to UTC and it will bite you
This module doesn’t output data. It just fires the scenario. Everything downstream pulls its own data.
Step 3: Pull Typeform Submission Count
Add a new module: Typeform > List Responses.
Connect your Typeform account and select your form. Then set the date filter:
- Since: Use Make’s date functions —
{{addDays(startOfWeek(now); -7)}} - Until:
{{startOfWeek(now)}}
This returns all responses submitted in the 7 days before the current Monday. Make.com treats startOfWeek as Monday by default in most locales — verify this in a test run if your numbers look off.
Common error here: Typeform’s List Responses module paginates at 25 results by default. If you had more than 25 submissions last week, you’ll only count 25. Fix this by clicking Show advanced settings and setting Max. number of returned responses to 200 (or whatever ceiling makes sense for your volume).
This module outputs a bundle per response. You don’t need the individual responses — you need the count. That comes in the next step.
Step 4: Aggregate the Count with a Numeric Aggregator
Add a Tools > Numeric Aggregator module after Typeform.
Settings:
- Source Module: Select the Typeform module
- Aggregate function: COUNT
- Value: Map any field from the Typeform bundle (e.g.,
{{response_id}}) — you’re counting rows, not summing values
The aggregator collapses all those individual bundles into a single output: one number. That number maps to column B in your sheet.
This is the module most beginners skip, then wonder why Make.com tries to write 47 rows instead of one summary row. The aggregator is the fix. For more on how Make.com handles data aggregation across modules, the Google Sheets integration workflow breakdown covers this pattern in detail.
Step 5: Pull New HubSpot Contacts
Add a HubSpot CRM > Search for Contacts module.
In the filter settings, add a filter for Create date:
- Operator: is after
- Value:
{{addDays(startOfWeek(now); -7)}}
This returns all contacts created in the last 7 days. You’ll need your HubSpot account connected — if you haven’t done that yet, the Make.com to HubSpot connection guide is the fastest path.
Add another Numeric Aggregator after this module, same settings: COUNT on any HubSpot contact field. This gives you your column C value.
If you’re not using HubSpot: Swap this module for whatever CRM you use. The aggregator pattern stays identical — only the source module changes.
Step 6: Write the Row to Google Sheets
Add a Google Sheets > Add a Row module.
Connect your Google account and select:
- Spreadsheet: Your dashboard file
- Sheet: Weekly Report
Make.com will read your headers and show each column as a field. Map them:
- Week Starting:
{{formatDate(addDays(startOfWeek(now); -7); "YYYY-MM-DD")}} - Form Submissions: Map the output of your first Numeric Aggregator (the COUNT result)
- New Contacts (CRM): Map the output of your second Numeric Aggregator
- Notes: Leave blank or hardcode “Auto-generated”
- Last Updated:
{{formatDate(now; "YYYY-MM-DD HH:mm")}}
The formatDate function is doing real work here. Without it, Make.com passes raw timestamps that Google Sheets doesn’t parse cleanly — you’ll get a number like 1717200000 instead of a readable date. Always format dates explicitly.
For a broader look at what’s possible when you treat Sheets as a data layer, see this step-by-step guide to automating Google Sheets with Make.com — it covers additional write patterns including updates and row lookups.
Step 7: Test Before You Schedule
Don’t trust it until you’ve seen it run. Click Run once in the bottom left of the canvas.
Watch each module execute. The bubbles above each module show you how many bundles passed through. You want:
- Schedule: 1 bundle
- Typeform List Responses: N bundles (one per response)
- Numeric Aggregator (Typeform): 1 bundle with your count
- HubSpot Search: M bundles (one per contact)
- Numeric Aggregator (HubSpot): 1 bundle with your count
- Google Sheets Add a Row: 1 bundle (one row written)
Open your Google Sheet. You should see one new row with the correct week, counts, and timestamp.
Common error: “Unable to parse the value of the ‘Range’ parameter.” This happens when Make.com can’t find the sheet tab by name — usually because there’s a trailing space in the tab name or a case mismatch. Fix it by clicking the sheet dropdown again and re-selecting instead of typing manually.
For a broader troubleshooting reference when things break unexpectedly, the Make.com error handling tutorial covers the most common failure modes and how to add error routes so your scenario doesn’t silently fail.
Step 8: Activate the Scenario
Toggle the scenario to Active using the switch in the bottom left. Make.com will now run it every Monday at 8 AM on the schedule you set.
Check the scenario history on the following Monday — you’ll see a green run in the execution log. If it’s red, the error message tells you exactly which module failed. Drill into it.
Adding More Data Sources
Once this pattern clicks, adding sources is just repeating Steps 3-5. Want to track weekly revenue from Stripe? Add a Stripe > List Payment Intents module, filter by date, aggregate the sum (not count) of the amount field, and map it to a new column.
Want social metrics? Pull from a Google Analytics module or a custom webhook. The sheet structure expands horizontally — add a column, add a module, map it. The scheduled trigger and the single-row write stay the same.
This is the no-code version of what engineers call an ETL pipeline: Extract from sources, Transform with aggregators, Load into Sheets — no code required.
If you’re thinking about how this fits into a wider automation setup for your business, this prioritization framework for workflow automation helps you decide what to automate next and in what order.
How to Automate Google Sheets Reporting: Ops Cost Reality Check
Make.com counts operations, not scenarios. Each module execution that processes a bundle costs one op. Here’s what this scenario costs per weekly run at different data volumes:
| Typeform Responses | HubSpot Contacts | Ops Per Run | Ops Per Month (4 runs) |
|---|---|---|---|
| 10 | 15 | ~30 | ~120 |
| 50 | 40 | ~98 | ~392 |
| 200 | 100 | ~308 | ~1,232 |
Make.com’s free plan gives you 1,000 ops/month. For most solopreneurs running this scenario, the free tier covers it. If you’re pulling higher volumes or running multiple scenarios, the Core plan is $9/month. For a full breakdown of what each plan actually covers, see the Make.com pricing breakdown.
Ready to build it? Start with Make.com’s free plan here — no credit card required, and 1,000 ops/month is enough to run this reporting scenario for months.

When This Pattern Breaks (And How to Fix It)
Problem: Data from two sources writes two rows instead of one.
Cause: You have two separate paths that both reach the Google Sheets module, so it fires twice.
Fix: Add a Tools > Set Variable module after each aggregator to store the count, then reference both variables in a single Google Sheets module at the end. Use a linear path, not parallel branches.
Problem: The date filter returns data from the wrong week.
Cause: Timezone mismatch between Make.com’s internal clock and your local timezone or the source app’s timezone.
Fix: In Make.com’s scenario settings, set the timezone explicitly. Then re-check whether the source app (Typeform, HubSpot) stores timestamps in UTC or local time — adjust your addDays offset accordingly.
Problem: Google Sheets shows column A as the timestamp instead of “Week Starting”.
Cause: Make.com mapped by column letter instead of header name because it couldn’t read the headers.
Fix: Make sure row 1 contains headers and the sheet isn’t filtered or frozen in a way that hides row 1. Re-open the Google Sheets module and re-map the fields after headers are visible.
This scenario is deliberately lean. It does one job: pull numbers and write them. Once it’s running cleanly, you can layer on more complexity — conditional logic with webhooks, content triggers, or AI-generated summaries using a Claude or GPT module that writes a plain-English recap into the Notes column.
For solopreneurs comparing their tool options before committing, the Make.com vs Zapier pricing and feature comparison shows why Make.com wins at this kind of multi-step, data-heavy scenario — especially on the free and Core tiers.
The Google Sheets reporting workflow you just built isn’t a one-time project. It runs every week and gives you clean data without you touching it. That’s the actual point. Stop copying numbers. Let the scenario do it.
Building this yourself? Get the workflow pack.
5 ready-to-import n8n workflows — lead capture, invoicing, content repurposing, onboarding, social posting. Free.