How to Automate Your Solopreneur Weekly Review with No-Code Tools
Your weekly review shouldn’t take 45 minutes of manual copying. If you’re pulling numbers from Google Sheets, checking HubSpot deal stages, and flipping between Notion pages every Friday afternoon, you’re spending focus time on data assembly — not on the decisions that data should drive.
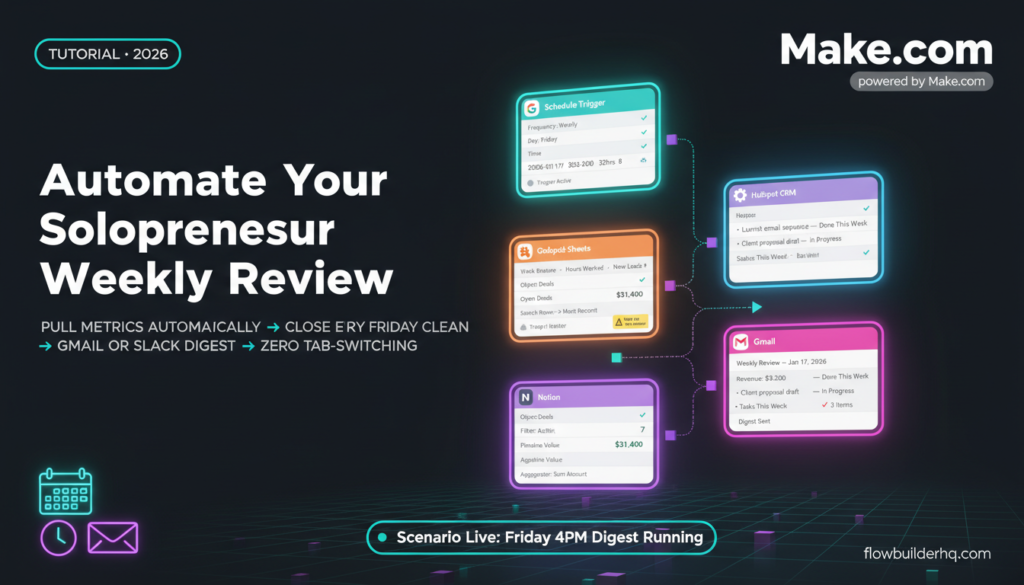
This tutorial walks through a Make.com scenario that runs every Friday at 4pm, pulls metrics from Google Sheets, Notion, and HubSpot, and assembles them into a single digest — delivered to your inbox (or Slack) before the week closes. The goal is a how to automate your solopreneur weekly review with no-code tools system you set up once and barely touch again.
If you’ve already got the morning routine automation running, this is its counterpart — an end-of-week loop that closes the feedback cycle instead of opening the day.
What This Scenario Does
At a high level, the Make.com scenario does the following:
- Triggers on a scheduled time (every Friday at 4pm)
- Reads your weekly metrics row from Google Sheets
- Pulls open deal count and pipeline value from HubSpot
- Fetches the current week’s tasks or project notes from a Notion database
- Formats everything into a structured HTML digest
- Sends it via Gmail (or posts to a private Slack channel)
No dashboard. No login. It arrives. You read it. You make decisions.
What You’ll Need Before You Start
- A Make.com account (free tier covers this scenario comfortably)
- Google Sheets with a weekly metrics tab (explained below)
- HubSpot free CRM with at least one active deal pipeline
- Notion with a database you use for weekly tasks or project notes
- A Gmail account connected to Make.com, or a Slack workspace
If you’re not using HubSpot yet and want to set up a pipeline first, the HubSpot free pipeline setup guide covers the exact structure this scenario expects.
Step 1: Set Up Your Google Sheets Metrics Tab
Create a tab called Weekly Metrics in whatever Google Sheet you use for tracking. The structure should have one row per week, with a date column and whatever KPIs matter to your business. A minimal setup:
| Week Ending | Revenue | Hours Worked | New Leads | Proposals Sent | Content Published |
|-------------|---------|--------------|-----------|----------------|-------------------|
| 2026-01-17  | 4200    | 32           | 8         | 3              | 2                 |
You fill this in manually during the week — or automate the fill via other scenarios. The weekly review automation reads the most recent row, so the sheet just needs to be current by Friday.
If you want the sheet itself to be auto-populated, the Google Sheets reporting automation guide covers that layer separately.
Step 2: Build the Make.com Scenario
Open Make.com and create a new scenario. You’ll build a linear chain of modules:
Module 1 — Schedule Trigger
Add a Schedule trigger module. Set it to run weekly, on Friday, at whatever time you want the digest to arrive. 4pm local time is a good default — you’re still in work mode, but the week is effectively done.
This is the only trigger. Everything else fires as a chain off this one.
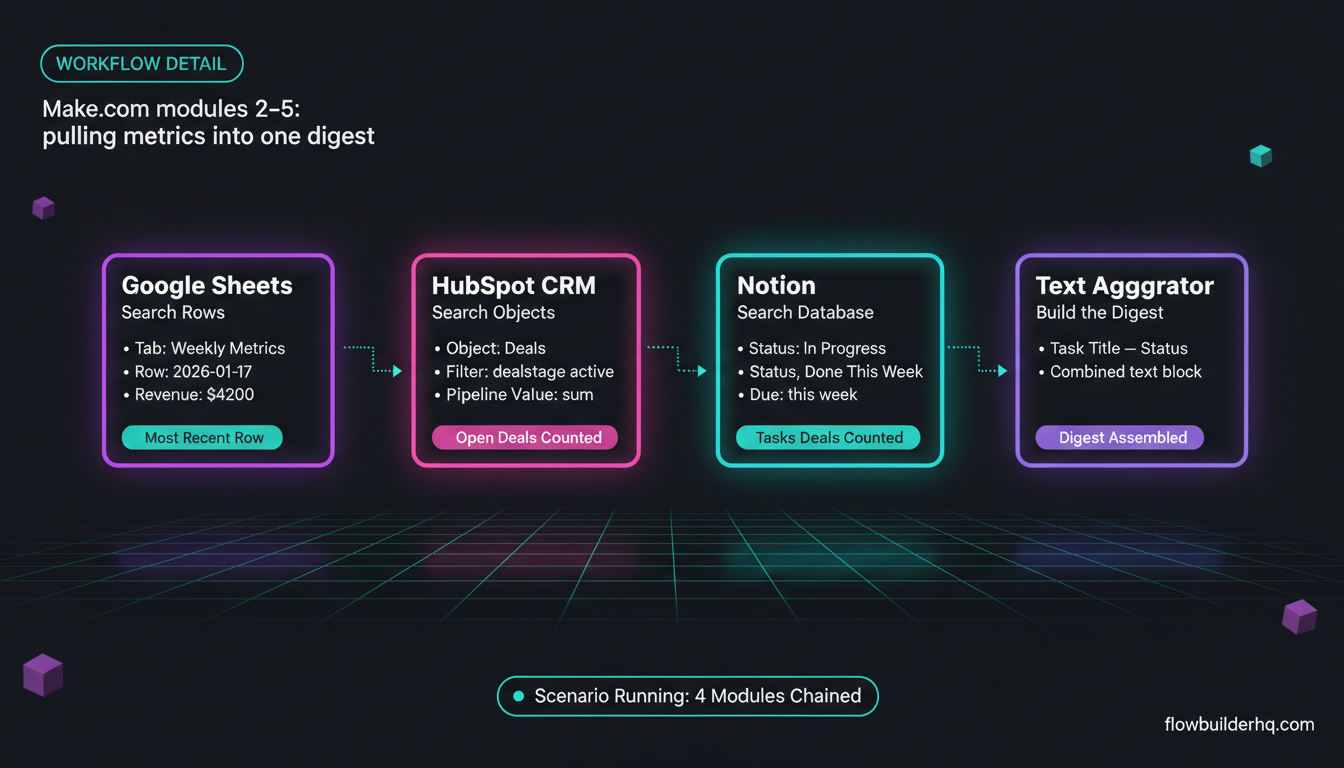
Module 2 — Google Sheets: Search Rows
Add a Google Sheets → Search Rows module. Connect your Google account, select the spreadsheet and the Weekly Metrics tab.
In the filter, set the Week Ending column to contain the current week’s date. Use Make’s built-in date function: formatDate(now; "YYYY-MM-DD") won’t match a specific Friday unless you calculate it. Instead, use:
formatDate(addDays(now; -weekday(now) + 6); "YYYY-MM-DD")That expression returns the date of the current week’s Friday regardless of when the scenario runs. Alternatively, leave the filter blank and set Maximum number of returned rows to 1 with sort order set to descending on the date column — this always grabs the most recent row.
Common error here: Make.com returns Google Sheets rows as an array even when only one row matches. Wrap the next modules in an iterator or reference the data as {{1.Row[1].Revenue}} rather than {{1.Row.Revenue}}. If you see a “cannot read property of undefined” error in the next module, this is almost always why.
For a deeper walkthrough of Google Sheets module patterns in Make, the Make.com + Google Sheets lightweight database guide covers the exact syntax.
Module 3 — HubSpot: Search Objects (Deals)
Add a HubSpot CRM → Search Objects module. Connect your HubSpot account. Set object type to Deals.
Filter by dealstage not equal to closedwon and not equal to closedlost — this gives you your active pipeline. You want two numbers: count of open deals and total pipeline value.
Make.com returns deal objects in an array. To get the count, use an Array Aggregator module after this one, or simply read the Total field from the HubSpot search response (it tells you how many records matched the filter).
For pipeline value, you’ll need a Numeric Aggregator module set to sum the amount property from each deal object. This gives you total open pipeline value as a single number.
If you want to get more granular — broken down by pipeline stage — see the Make.com to HubSpot integration tutorial for the object property mapping.
Module 4 — Notion: Search Database
Add a Notion → Search Objects in a Database module. Connect your Notion workspace. Select the database where you track weekly tasks, projects, or deliverables.
Filter by a Status property. You want tasks with status In Progress or Done This Week (whatever you call your completed state). This surfaces what actually happened during the week, not the full backlog.
If your Notion database uses a Date property for due dates, you can filter to only show items with a due date in the current week. Use Make’s date range filter: is on or after the Monday of this week and is before next Monday.
The Make.com + Notion workspace automation guide covers the full database filtering syntax if you run into property mapping issues.
Module 5 — Text Aggregator (Build the Digest)
Add a Text Aggregator module. This is where the digest gets assembled. Set the source module to your Notion Search module (so it iterates over each task result). In the text field, build the task list:
• {{4.title}} — {{4.Status}}This produces one line per Notion item. The aggregator combines them into a single text block you’ll use in the email.
Module 6 — Gmail: Send an Email (or Slack: Create a Message)
Add a Gmail → Send an Email module. Set the recipient to your own email address. Subject line: Weekly Review — {{formatDate(now; "MMM D, YYYY")}}
In the body (HTML format), assemble the digest like this:
<h2>Weekly Review — {{formatDate(now; "MMM D, YYYY")}}</h2>

<h3>Business Metrics</h3>
<ul>
  <li>Revenue: ${{2.Row[1].Revenue}}</li>
  <li>Hours Worked: {{2.Row[1].Hours Worked}}</li>
  <li>New Leads: {{2.Row[1].New Leads}}</li>
  <li>Proposals Sent: {{2.Row[1].Proposals Sent}}</li>
  <li>Content Published: {{2.Row[1].Content Published}}</li>
</ul>

<h3>Pipeline (HubSpot)</h3>
<ul>
  <li>Open Deals: {{3.total}}</li>
  <li>Pipeline Value: ${{sum_from_aggregator}}</li>
</ul>

<h3>Tasks This Week (Notion)</h3>
{{5.text}}
Replace the module reference numbers with whatever Make assigns in your actual build. The numbers above (2, 3, 5) are illustrative.
If you’d rather receive this in Slack, swap the Gmail module for Slack → Create a Message and post it to a private channel named #weekly-review. The Slack notifications with Make.com guide covers message formatting with blocks if you want a cleaner layout.
Step 3: Test Before You Schedule
Run the scenario manually before activating the schedule. Click Run once in the Make.com scenario editor. Check each module’s output bubble — click the bubble to see the raw data each module returned.
Things to verify:
- Google Sheets module returned a row (not an empty array)
- HubSpot returned deals with an
amountproperty populated - Notion returned page objects with the right title and status fields
- The email arrived with real data, not blank fields
If any source is empty, the digest will send with blank sections. Add a Filter module after the Sheets module to stop the scenario if no row was found, with an error notification instead. The Make.com error handling tutorial walks through exactly this pattern.
Step 4: Add a Weekly Notes Input (Optional but Useful)
The automated digest covers numbers. But a good weekly review also includes qualitative notes: what worked, what didn’t, what you’re carrying into next week.
The cleanest approach: add a dedicated section in your Notion weekly tasks database for a Weekly Notes page. Give it a unique tag or status so the Make scenario can identify it and pull the page content. Include the text content in the digest as a final section.
Alternatively, keep a simple Google Sheets row for notes — a single “Notes” column in your Weekly Metrics tab. It travels with the metrics and doesn’t require additional Notion filtering.
Albato as an Alternative Integration Layer
If your stack doesn’t include HubSpot, or you’re running a different CRM that Make.com doesn’t have a native module for, Albato is worth evaluating as the integration layer. It supports a broader set of Russian and European CRMs, some niche project management tools, and several apps where Make’s native modules are limited or require a paid plan to unlock.
Albato’s pricing starts at $25/month for its Pro plan. The core logic of the weekly review scenario — scheduled trigger, data pulls from multiple sources, formatted message output — is fully replicable in Albato’s builder. The UI is less visual than Make’s canvas, but the module chaining follows the same logic.
For a direct comparison of how these platforms handle multi-source scenarios, the no-code automation tools roundup for 2026 covers both alongside the other main contenders.
Ops Count: Will This Hit Make’s Free Tier?
The free Make.com plan gives you 1,000 operations per month. This scenario uses roughly 6-10 operations per run depending on how many Notion items it iterates over. Running once per week: 4 runs × 10 ops = 40 operations per month. Well inside the free tier.
Even if you add branches, error handling, and Slack output, you’ll stay under 100 ops/month for this scenario. If you want to understand Make’s operation counting in detail before scaling other workflows, the Make.com pricing breakdown explains how ops are counted across modules and iterations.
What to Review When the Digest Arrives
Automation delivers the data. The review is still on you. A weekly review system only works if you act on what it surfaces. A few questions worth building into your Friday habit:
- Revenue vs. target: Are you tracking toward your monthly number or behind?
- Pipeline health: Are open deals moving or stalling? If pipeline value is high but deal count is low, you have concentration risk.
- Capacity signal: Hours worked vs. revenue per hour. If one goes up without the other, something is off.
- Output completion rate: How many tasks marked “Done” vs. what you planned? Consistent gaps signal a planning problem, not a productivity problem.
If you’re not sure which metrics to track for your specific business type, the workflow automation prioritization framework covers how to identify which data points actually influence decisions versus which ones just feel productive to track.
Scaling This Later
Once the base scenario is running cleanly, there are two common extensions:
Add an AI summary layer. Route the assembled digest text through an OpenAI or Anthropic Claude API call before sending. Prompt it to surface the one thing most worth attention based on the numbers. You’ll get a one-paragraph “so what” alongside the raw data. The Claude AI for business automation guide covers setting up the API module in Make.
Add a month-end rollup. Duplicate the scenario, change the schedule to the last Friday of each month, modify the Google Sheets module to aggregate the last four weeks of rows instead of just the most recent one, and send a monthly summary alongside the weekly digest.
The same structure scales cleanly. You built the plumbing once. Adding layers is just adding modules.

How to Automate Your Solopreneur Weekly Review: The Final Setup
The full scenario is six modules. It runs every Friday without you touching it. The digest arrives in your inbox with the numbers you need to close the week cleanly. No tab-switching. No copy-pasting. No wondering what happened.
That’s the point of a Make.com scenario for weekly reviews — not the automation itself, but the consistency it enforces. You’re far more likely to actually do a weekly review when the data is already waiting for you.
If you’re new to Make and want to get the foundational setup right before building this, start with the Make.com scenario beginner tutorial — it walks through the interface and module logic from zero.
Ready to build? Start with Make.com’s free plan — 1,000 ops/month is more than enough to run this scenario every week at no cost.
Building this yourself? Get the workflow pack.
5 ready-to-import n8n workflows — lead capture, invoicing, content repurposing, onboarding, social posting. Free.